1. Introduction to BPSC Statistics Questions in Mains Examination
Statistics is an important component of GS Paper-I in the BPSC Mains examination, usually appearing in Section-III. These questions are designed to test a candidate’s ability to interpret numerical data, analyse graphs and tables, and perform basic calculations accurately. Unlike theoretical questions, BPSC Statistics Questions require careful observation of the given data and logical problem-solving within a limited time.
Most statistics questions in BPSC mains are based on bar graphs, pie charts, line graphs, tables, and data interpretation problems. Candidates are expected to calculate percentages, ratios, averages, and trends based on the information provided in the question.
This page compiles BPSC Statistics Questions from the 60th to the 70th BPSC Mains examinations in a clear year-wise format. Practising these questions helps aspirants understand the pattern of bpsc statistics pyq and improve both speed and accuracy for the mains examination.
2. Why Practising BPSC Mains Statistics PYQ is Important
Practising BPSC Statistics Questions from previous examinations is one of the most effective ways to prepare for Section-III of GS Paper-I. Statistics questions in BPSC mains are usually data-based and calculation-oriented, which means accuracy and clear interpretation are very important for scoring well.
When aspirants solve bpsc mains statistics pyq, they become familiar with the pattern of graphs, charts, and numerical data used in the examination. Regular practice helps candidates understand how to interpret tables, identify trends, and perform calculations such as percentages, ratios, and averages within the given time.
Another advantage of analysing bpsc statistics pyq is that many questions follow similar formats across different years. By practising previous questions, aspirants can improve both speed and confidence while solving statistics problems in the mains examination.
Therefore, consistent practice of statistics pyq for bpsc mains is essential for mastering this scoring section.
3. BPSC Statistics Questions (60th–62nd BPSC)
The 60th–62nd BPSC Mains examinations included several questions from the statistics section of GS Paper-I. These BPSC Statistics Questions mainly focused on interpreting numerical data presented through charts, graphs, and tables.
When aspirants practise bpsc mains statistics pyq from these examinations, they can observe that most questions require candidates to calculate percentages, ratios, averages, and comparisons between different data values. Accuracy in calculation and careful reading of data are essential to solve these questions correctly.
Another noticeable aspect of these bpsc statistics pyq is that many questions contain multiple sub-parts, where each part is based on the same dataset. This requires candidates to understand the entire data set before attempting the calculations.
Studying these statistics pyq for bpsc mains helps aspirants develop a strong foundation for solving statistics questions in later examinations.
60-62nd BPSC Statistics Questions
1. Study the following line graph which gives the percentage profit earned by the three companies A, B and C during the period from 2011 to 2016 and answer the questions given below:
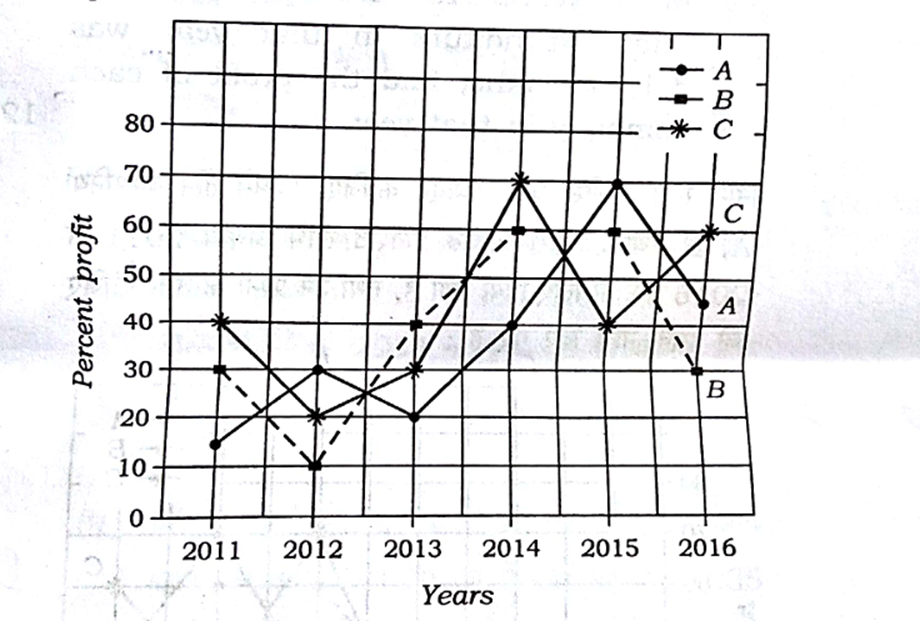
(a) The income of company B in 2012 was Rs. 60 Laks, which increased by 30% in the year 2013. Find the expenditure of company B in the year 2013.
(b) If the expenditures of companies A, B and C in the year 2016 were equal and their total income in that year was ₹ 870 lakhs, find the profit of each company in that year.
(c) If the companies A, B and C had an expenditure of ₹ 200 lakhs, ₹ 300 lakhs and ₹ 400 lakhs respectively in the year 2014, find the ratio of their profits in 2014.
(d) If the incomes of companies A, B and C in the year 2015 were equal and their total expenditure in that year was ₹ 1,835 lakhs, find the profit of each company in that year.
2. Study the data given in the following multiple bar chart which shows the production, export and import (in ₹ crore) of country X during the period from 2006 to 2013 and answer the questions given below it:
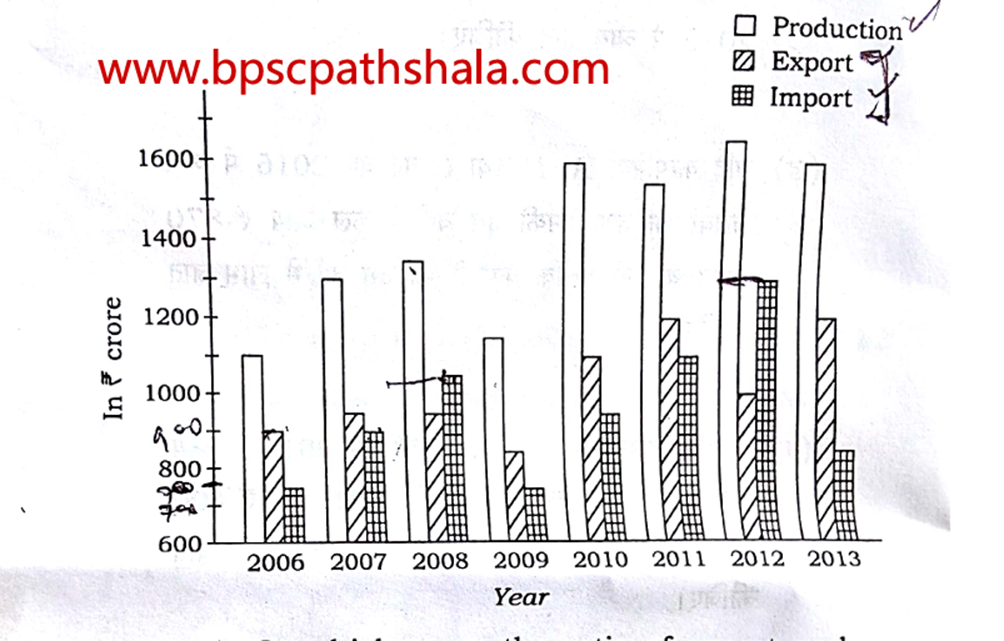
(a) In which years the ratio of export and import was maximum and minimum for country X? What were those ratios?
(b) In which year the highest percent of its production was exported? What was that percentage value ?
(c) If for the country Y, the ratio of production, import and export is 7:6:5 and production in Y in the year 2014 is double the production in X in the year 2013, what was the value of the export and import from country Y in the year 2014?
(d) What percentage of production was imported in the year 2008 and 2012 in country X?
(e) What percentage of export should be increased in 2007 in X so that the difference between its production and export is 1/4 of its import?
3. Study the following pie-charts which show the sales for a company in India in the year 2016-17 and answer the questions given below it:
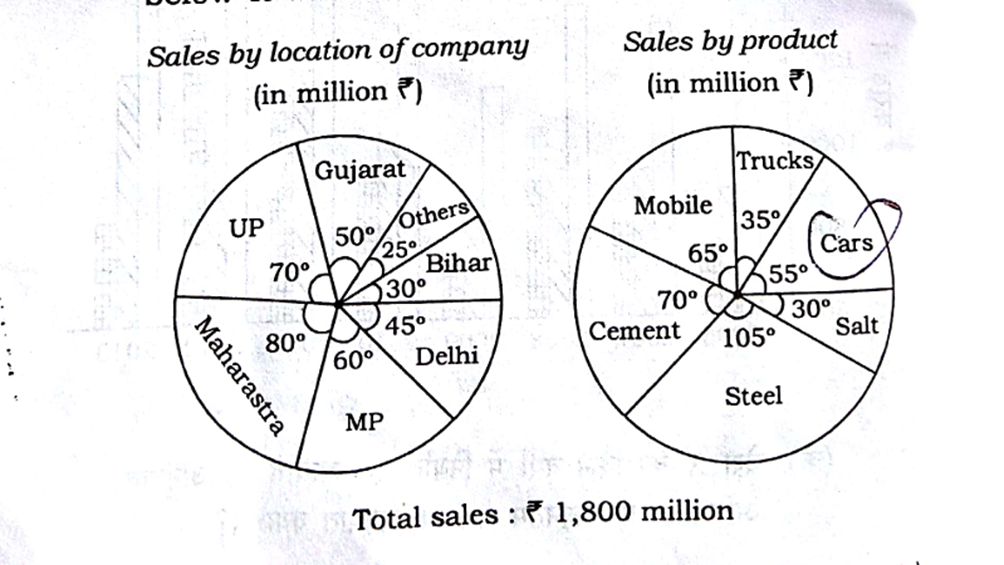
(a) In the next year, the sales of cars were expected to be double, assuming that the total sales are increased by ₹ 200 million, what would be the percentage share of cars in the total sales?
(b) If in the subsequent year, the mobiles are to increase their share by 20%, then assuming that the total sales are again increased by ₹ 200 million, by how many millions of rupees the mobile sales would be increased?
(c) If 40% of the cement sales were in Maharashtra, then what was the value of sales of other products in Maharashtra in 2016-17?
(d) If in 2016-17, Delhi has the sales of only cement, steel and cars and that in the ratio 5:3:1, then what percentage of cement out of total cement sales in India was sold in Delhi?
4. The following graph shows the expenditure on arms of the three countries A, B and C (in ₹ thousand million). Answer the questions that follow on the basis of the graph:
Answer the questions that follow on the basis of the graph:
(a) Which country had the steepest rise in its expenditure on arms compared to the previous year and in which year?
(b) What was the percentage increase in expenditure on arms of country A in 2017 compared to 2012?
(c) The amount spent by country B in 2017 is what percentage of amount spent by it in 2011?
(d) If in 2018, the amount spent by country C will be 30% more than that in the last year and the amount spent by country A in 2018 remains same as that in 2017, what will be the difference between the amounts spent by the countries C and A in arms in the year 2018?
(e) What percentage of expenditure on arms should be increased by the countries A and B in 2015 so that the expenditure on arms by A, B and C becomes same for the year 2015?
4. BPSC Statistics Questions (63rd BPSC)
The 63rd BPSC Mains examination also included important questions from the statistics section of GS Paper-I. These BPSC Statistics Questions were based on data interpretation using tables, graphs, and numerical datasets. Candidates were required to analyse the information carefully and perform accurate calculations.
When aspirants practise bpsc mains statistics pyq from the 63rd BPSC examination, they can observe that the questions mainly test the ability to calculate percentages, ratios, averages, and comparisons between different data values. Such questions require both attention to detail and logical interpretation of the given data.
Another key feature of these bpsc statistics pyq is the presence of multiple sub-questions based on a single dataset. Candidates must carefully interpret the data before performing calculations.
Studying these statistics pyq for bpsc mains helps aspirants improve their calculation accuracy and become more confident in solving statistics questions in the mains examination.
63rd BPSC Statistics Questions
1. In a city of Maharashtra, the main mode of transport is cars. The following chart shows the population trends and car trends during the period 2011–2016. Study the chart and answer the questions that follow:
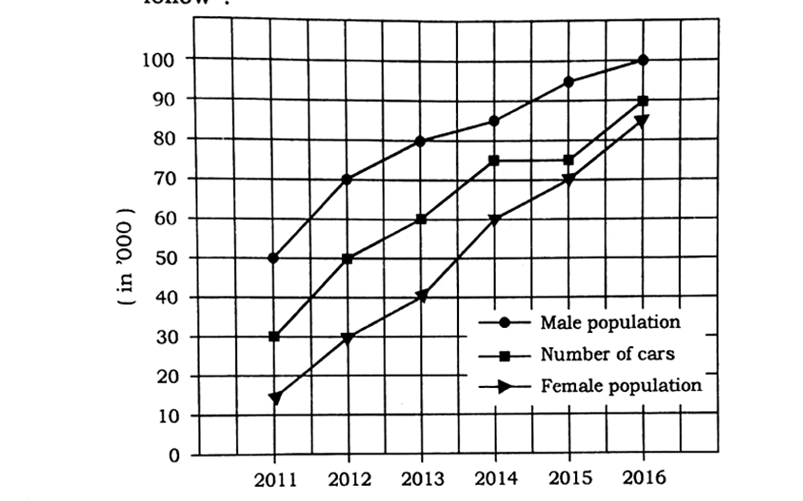
(a) In 2014, if the females used 30% of the total cars, then what is the per capita use of cars by females in 2014?
(b) What is the average percentage increase in number of cars over the period 2011–2016?
(c) Find the year in which the ratio of males to that of females was the highest.
(d) If in 2012, 60% of cars are used by males, then what is the percentage of males and females who used car in the year 2012?
(e) In which year the ratio of male population to the number of cars in the city was lowest?
(f) With what percentage, the number of cars in the city was increased from 2011 to 2016?
2. Study the following pie charts, which show the expenditure on various heads in the second and third Five-Year Plans (FYP) and answer the questions given below it :
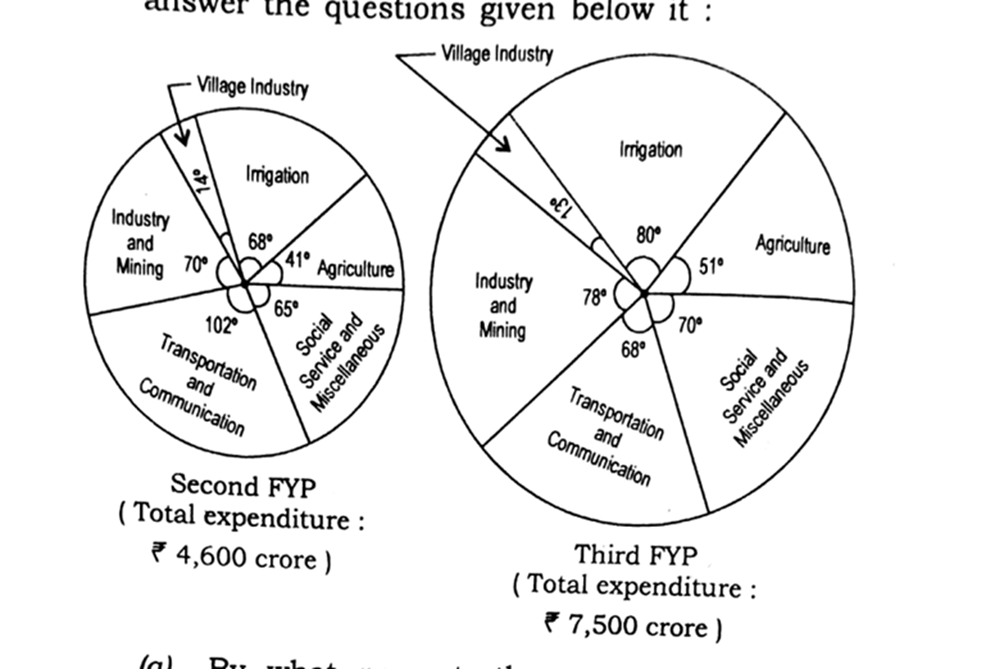
(a) By what percent, the expenditure in irrigation increased in the third FYP in comparison to the second FYP?
(b) What is the ratio of expenditure in village industry in the second and third FYPs?
(c) By what amount, the expenditure in agriculture in the third FYP should have been increased or decreased so that to make it 2·5 times the expenditure made in the second FYP?
(d) By what percent, the expenditure in agriculture in the third FYP is higher or lower than the expenditure in industry and mining in the second FYP?
(e) By what amount, the expenditure in transportation and communication increased or decreased in the third FYP in comparison to the second FYP?
(f) If the total expenditure in the fourth FYP is increased by 80% to that of the third FYP and the segment of expenditure on social service and miscellaneous makes an angle of 78° at the centre of pie chart for the fourth FYP, then what will be the expenditure on social service and miscellaneous in the fourth FYP?
3. Study the data given in the following multiple bar chart, which shows the sex ratio in Madhya Pradesh during the period from 1901 to 1971 and answer the questions given below it :
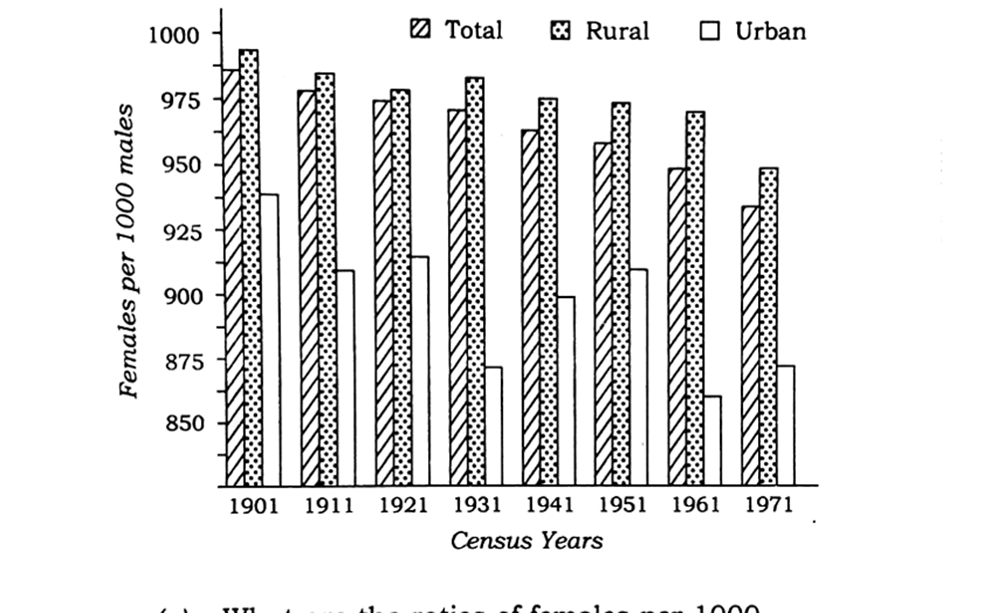
(a) What are the ratios of females per 1000 males in rural and urban areas of Madhya Pradesh in 1941 and 1951 census? In which year was it higher?
(b) What is the percentage change in females per 1000 males in urban areas of Madhya Pradesh in 1961 in comparison to 1931?
(c) Compare the ratio of females per 1000 males in total and rural areas of Madhya Pradesh in 1911 and 1921 Census. In which year was it higher?
(d) In which census years, were the female sex ratio in urban areas of Madhya Pradesh highest and lowest ? What is the difference between these two?
(e) If in 1931 Census, due to some error in counting, 15 females per 1000 males were wrongly counted in urban area instead of rural area of Madhya Pradesh, then what should have been the actual percentage of females per 1000 males in urban area of Madhya Pradesh to that of rural area in 1931 ?
(f) If in 1971 Census, there were 90 crore males in rural areas of Madhya Pradesh, then what is the difference between male and female population in rural areas of Madhya Pradesh in 1971 ?
4. Study the following line graph, which gives the Public Sector Banks advances (₹ in crores) to the three priority sectors, viz., agriculture, small-scale industries and other private sectors during the period from 1970 to 1976 and answer the questions that follow :
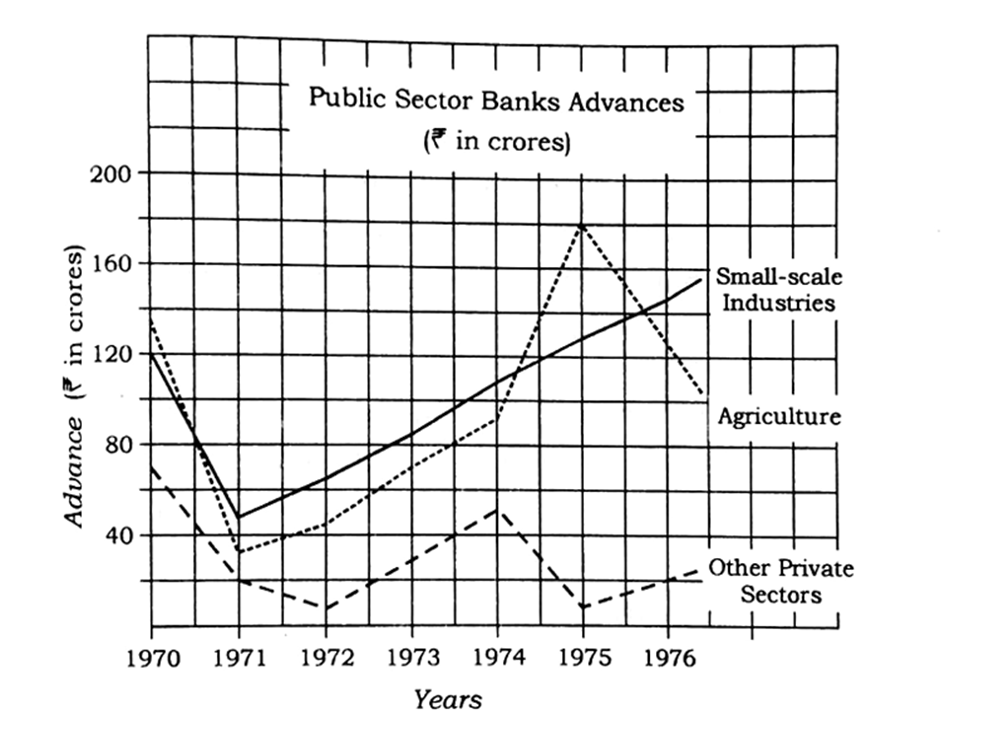
(a) What percentage of more advance was given by the public sector banks to small-scale industries in comparison to agriculture in 1971?
(b) Find the ratio of advance given by the public sector banks to agriculture, small-scale industries and other private sectors in 1972.
(c) The total advance counted yearly from 1970 to 1976 by the public sector banks to small-scale industries is what percentage of that to agriculture ?
(d) If 40% of advance given to small-scale industries is utilized in cottage industry, what amount was utilized in cottage industry in 1975 ?
(e) Find the ratio of advances given by the public sector banks at three occasions between 1970 to 1976, when it was equal for agriculture and small-scale industries.
(f) In which two years there was decrease in advance given by public sector banks to agriculture relative to the last year ? Also find the percentage decrease in advance in these two years.
5. BPSC Statistics Questions (64th BPSC)
The 64th BPSC Mains examination followed the same pattern for statistics questions in GS Paper-I. These BPSC Statistics Questions required candidates to interpret information presented through charts and graphs and answer multiple sub-parts based on the given data.
Practising bpsc mains statistics pyq from the 64th BPSC helps aspirants understand how data interpretation questions are structured in the examination. Most questions focus on percentage calculations, comparative analysis, and numerical trends derived from the dataset.
Another important aspect of these bpsc statistics pyq is the need for careful reading of the graphical information. Even small mistakes in interpreting the chart or table can lead to incorrect answers.
By practising these statistics pyq for bpsc mains, aspirants can improve both their speed and accuracy while solving numerical questions in the mains examination.
64th BPSC Statistics Questions
1. The following charts depict the distribution of overseas tourists from India to various countries and also the age distribution of tourists from India during the year 2017 :
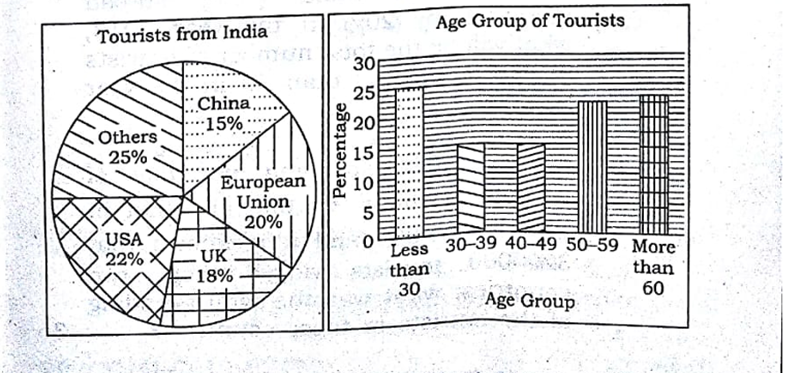
(a) If amongst the European Union, Switzerland accounts for 25% of tourists traffic and it is known from official Indian sources that a total of 4 lakh tourists visited Switzerland during the year 2017, then how many total numbers of Indian tourists in the age group of 40–49 years went abroad during the year 2017?
(b) If the total number of tourists of age group 30–49 is 2,40,000, what is the number of tourists who are more than 60 years of age ?
(c) If total number of Indian tourists who went to China more than 40 years of age, was 36,000 constitutes 30% of total tourists to China, then how many tourists of other age groups went to China ?
(d) Assuming that the total number of tourists from India going abroad increased by 20% in the year 2018, what will be the total number of tourists in age group less than 30 in the year 2018 ?
(e) If per capita spending per day of tourists in UK is ₹ 6,000 and that in USA is ₹ 5,000 and it is known that 32,00,000 tourists visited these two countries, what was the total spending of the tourists in these countries ?
2. The following multiple bar chart shows production of same type of vehicles (in thousands) over a period of three years by selected manufacturers and the line chart shows prices of vehicles in the year 2017 :
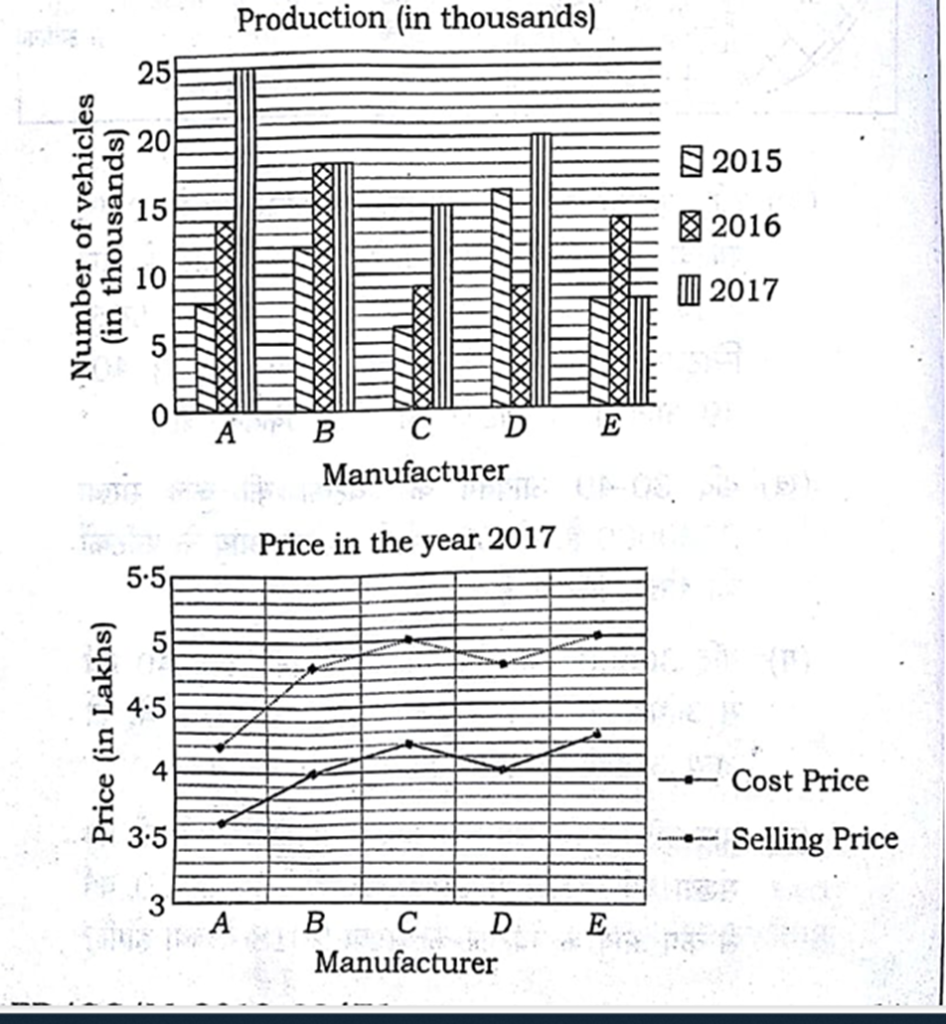
(a) What is the percent increase in the production of vehicles in 2017 from 2015 ?
(b) Which manufacturers have produced the same number of vehicles during the period under consideration ?
(c) What percent of the total production of vehicles is produced by manufacturers A and D?
(d) For which manufacturer, the profit is maximum in the year 2017 ?
(e) If the manufacturer D had to call back 4,000 of its vehicles due to some defects, what is percent profit/loss of the company ?
3. The following graph shows the populations of three countries during the years 2012–17.
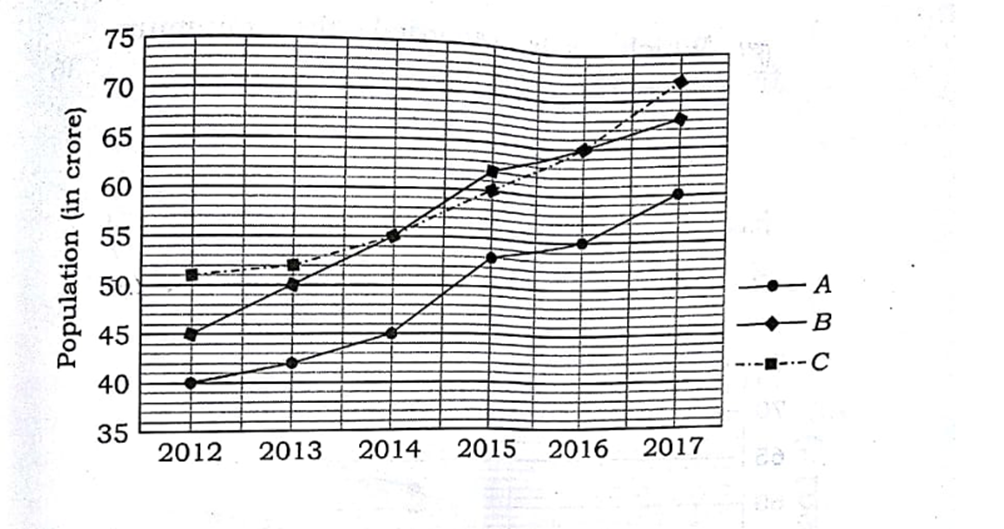
(a) What percent of total population is accounted by the country A in the year 2017 ?
(b) If the sex ratios of countries B and C in the year 2016 were 106·5 and 105·2, what is the number of females in these countries ?
(c) If the number of females in the country A in the year 2014 is 21·25 crores, what is the sex ratio of country A in the year 2017 ?
(d) Which year recorded the maximum growth of population in three countries ?
(e) Which year recorded the minimum growth of the population ?
4. The graph below gives exports (₹ in thousand crore) from three companies X, Y and Z over three years.
Study the line graph and answer the questions given below :
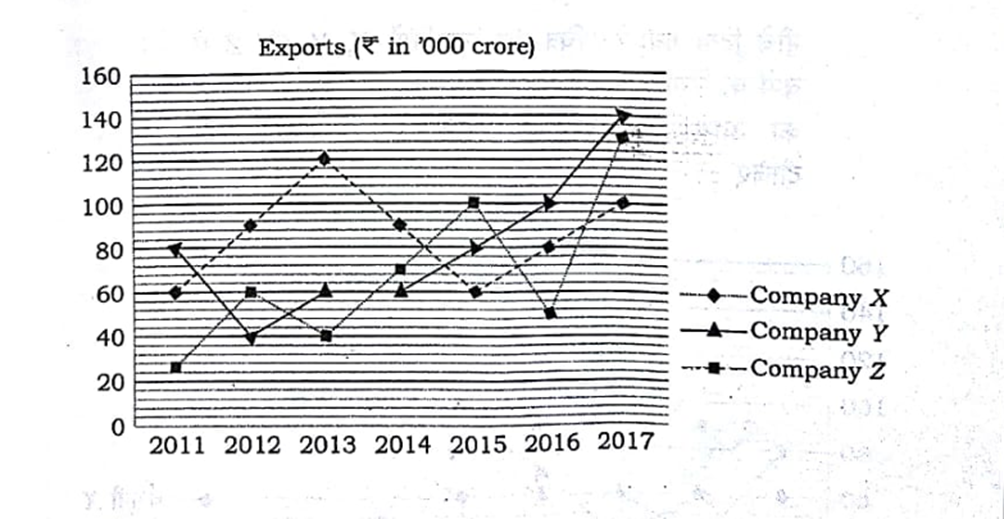
(a) Average annual exports for company X and Y, respectively are approximately what percent of the average annual exports of company Z during the given period ?
(b) What is the difference between the maximum and the minimum average annual export over the years ?
(c) In which years, the average annual exports of the companies were same ?
(d) In which years, the exports from company Z were more than the average annual exports of all the companies ?
(e) What is the percent increase in the total export of all the companies during the years 2015–2017 in comparison to the years 2011–2014 ?
6. BPSC Statistics Questions (65th BPSC)
The 65th BPSC Mains examination also included several questions from the statistics section of GS Paper-I. These BPSC Statistics Questions were mainly designed to test candidates’ ability to interpret numerical data and perform calculations based on graphs and tables.
When analysing bpsc mains statistics pyq from this examination, it becomes clear that most questions focus on percentage change, ratio calculations, average values, and comparison of data sets. These problems require careful observation of the dataset before performing calculations.
Another notable feature of these bpsc statistics pyq is that the questions often contain several sub-parts, each requiring a different type of calculation. Candidates must understand the data clearly to answer all parts correctly.
Practising these statistics pyq for bpsc mains helps aspirants develop confidence in handling numerical problems and improve their performance in the statistics section of the mains examination.
65th BPSC Statistics Questions
1. Given below is a pie diagram of population pertaining to the year 1998 and the table pertaining to sex and literacy-wise population ratio of different States of India. Read these carefully and give answers to the questions that follow:
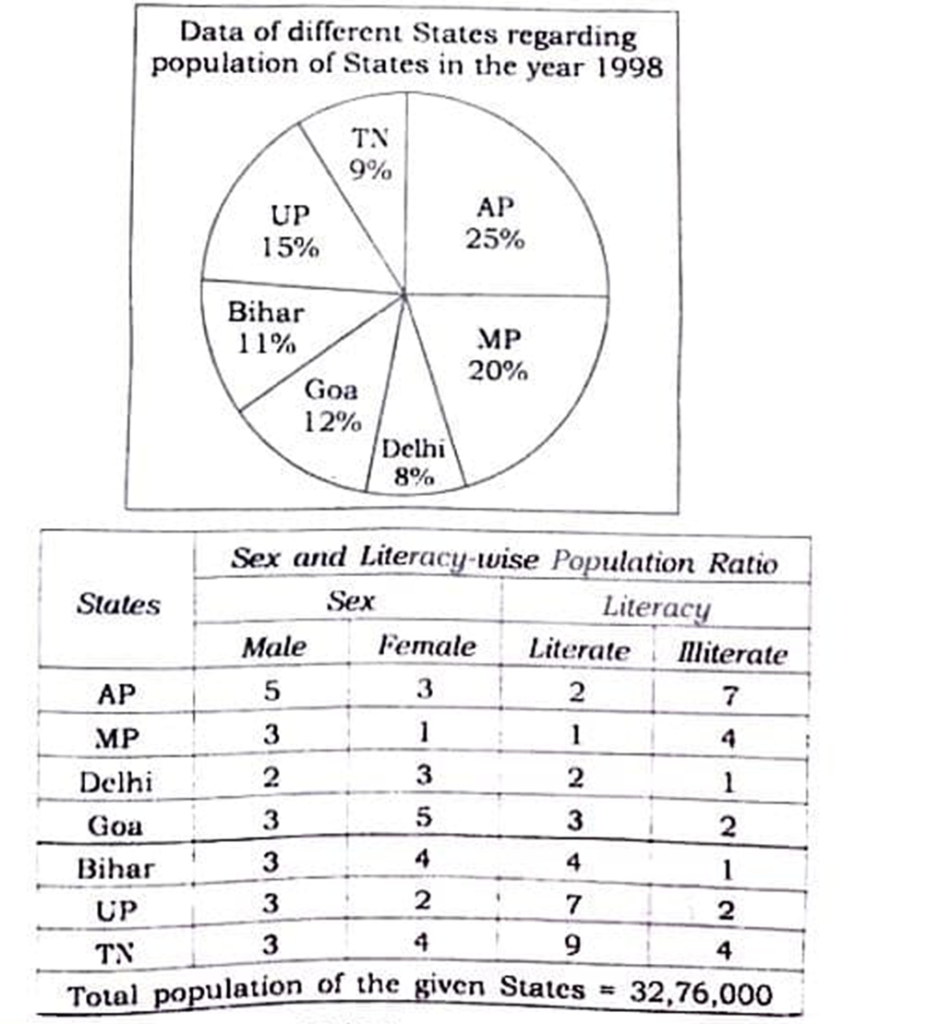
(a) What will be the percentage of females in UP, MP and Goa taken together of the total population?
(b) What was the total number of illiterate people in Bihar and UP?
(c) Find the ratio of the number of females in Delhi and Tamil Nadu.
(d) What was the percentage of females in all the mentioned States taken together?
2. The following chart shows the production of cars in thousands for different companies in India. Read the multiple bar diagram and answer the questions given below :
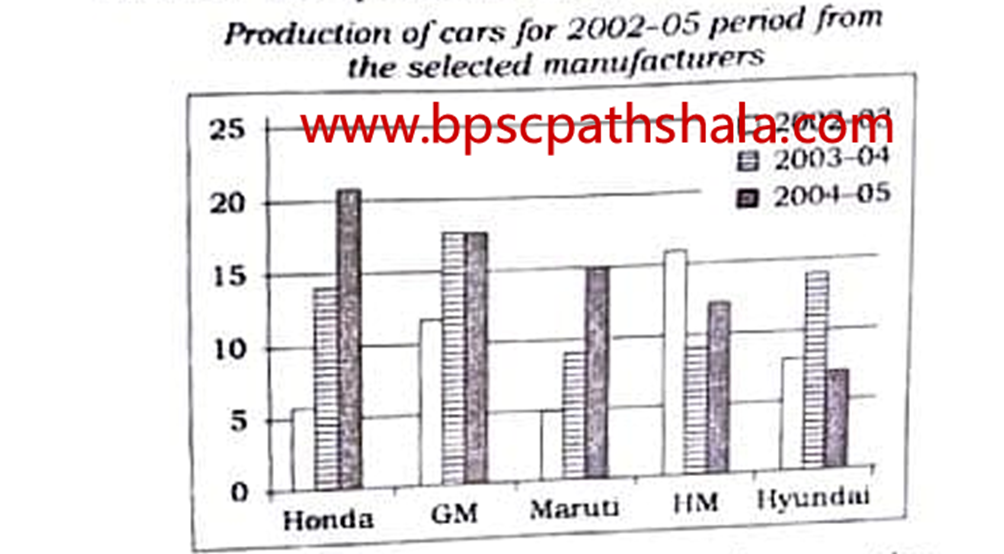
(a) Which companies have shown the highest and the lowest percentage increase and decrease in production over last year? Also give the actual percentages.
(b) What is the ratio of differences between productions by Maruti and Honda during 2003-04 and 2004-05?
(c) What are the ratios of total production of cars during the successive years?
(d) In 2005-06, the production of cars by Maruti and Hindustan Motors was doubled, while for all other companies the production remains the same. What is the percentage increase in overall production?
3. Study the following graphs and answer the questions given below :
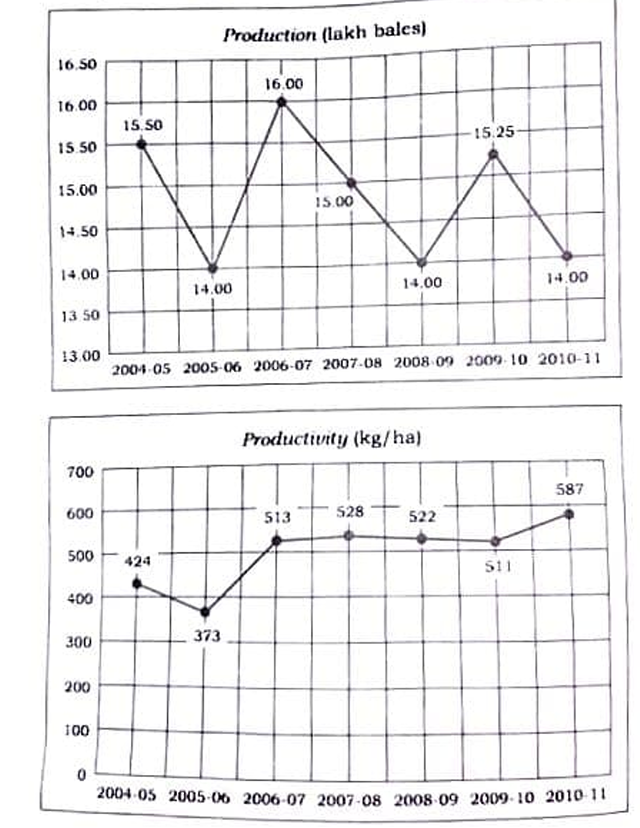
(a) What was the percentage increase in cotton production and productivity in 2006-07 as compared to 2005-06?
(b) In how many hectares, the cotton was grown in 2009-10 and 2010-11?
(c) In which year, the cotton production has shown maximum percentage decrease as compared to last year?
(d) In which year, the cotton has shown maximum percentage increase in productivity as compared to last year?
(e) In which year cotton cultivation area was the lowest and how much percentage of maximum area?
(f) Assuming cotton price as ₹ 1,250 per quintal, what would have been the income of a farmer who had 5 hectares of cotton area in 2008-09?
4. Study the following line graph which gives the number of students who joined and left the school in the beginning of the year for six years from 1996 to 2001. Initial strength of the school in 1995 was 3000. Answer the questions based on the line graph given below :
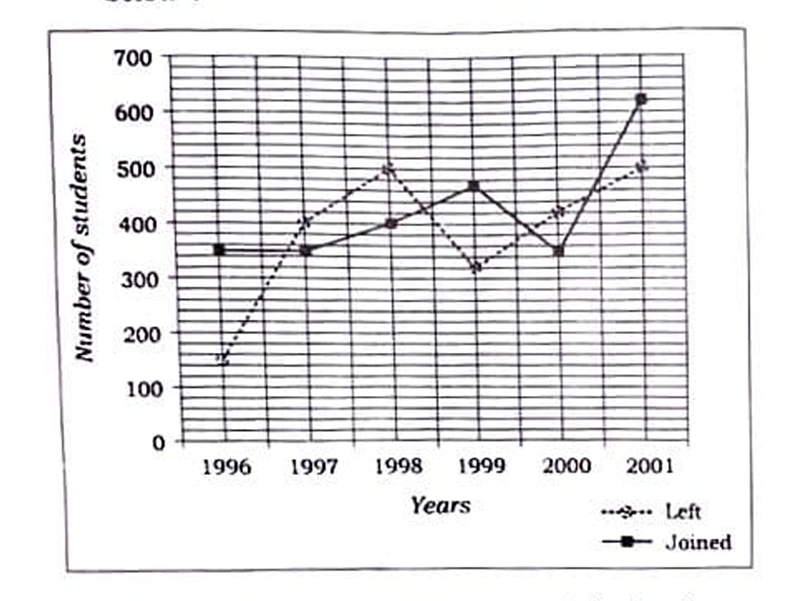
(a) The number of students studying in the school in 1998 was what percent of the number of students studying in the school in 2001?
(b) Find the ratio of the least number of students who joined the school to the maximum number of students who left the school in any of the years during the given period.
(c) During which year, the percentage increase in the strength of school was minimum?
(d) What was the percent increase/decrease in the number of students from 1998 to 1999?
(e) Find the ratio of the maximum number of students who joined the school to the minimum number of students who left in any of the years.
(f) In which year, the strength of the school was maximum?
7. BPSC Statistics Questions (66th BPSC)
The 66th BPSC Mains examination continued the established pattern of statistics questions in GS Paper-I. These BPSC Statistics Questions were based on interpreting data presented through charts, tables, and graphical representations.
When aspirants practise bpsc mains statistics pyq from the 66th BPSC examination, they can observe that most questions require calculations related to percentages, ratios, averages, and differences between numerical values. Accuracy and careful interpretation of data are essential to solve these questions correctly.
Another important aspect of these bpsc statistics pyq is the requirement to analyse the dataset logically before attempting calculations. Candidates must understand the relationship between different data points in order to answer the questions correctly.
Studying these statistics pyq for bpsc mains helps aspirants strengthen their ability to interpret numerical data and perform calculations efficiently during the examination.
66th BPSC Statistics Questions
1. The pie chart provided below gives the distribution of land (in a village) under various food crops. Study the pie chart carefully and answer the questions given below :
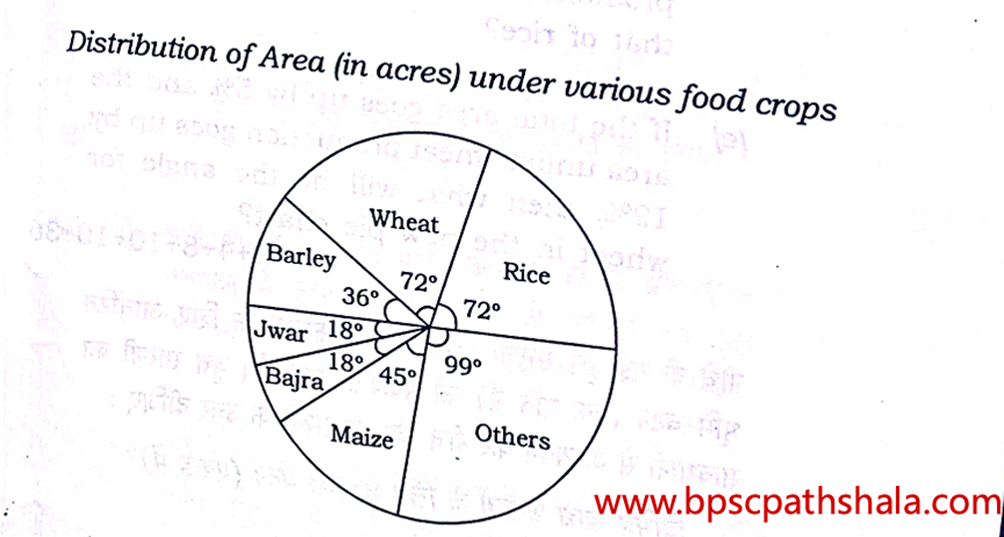
(a) Which combination of three crops contributes to 50% of the total area under the food crops ?
(b) If the total area under jwar was 1·5 million acres, then what was the area (in million acres) under rice ?
(c) If the production of wheat is six times that of barley, then what is the ratio between yield per acre of wheat and barley ?
(d) If the yield per acre of rice was 50% more than that of barley, then the production of barley is what percent of that of rice ?
(e) If the total area goes up by 5% and the area under wheat production goes up by 12%, then what will be the wheat in the new pie chart ?
2. The following line graph gives the percent profit earned by two companies X and Y during the period 1996–2001. Study the line graph and answer the questions that are based on it :
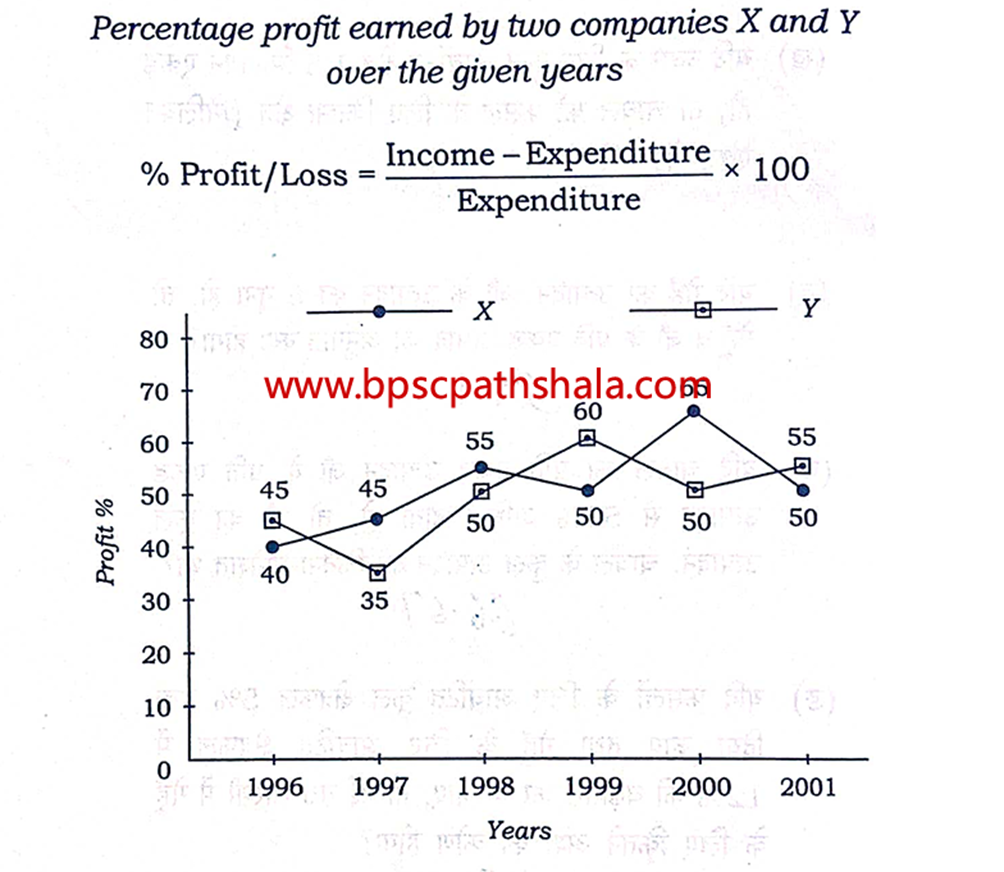
(a) If the expenditure of company X in 1997 was ₹ 220 crores, what was its income in 1997 ?
(b) If the income of two companies were equal in 1997, then what was the ratio of expenditure of company X to that of company Y in 1997?
(c) The income of the companies X and Y in 2000 were in the ratio of 3 : 4 respectively.
What was the respective ratio of their expenditures in 2000 ?
(d) The expenditures of companies X and Y in 1996 were equal and the total income of the two companies in 1996 was ₹ 342 crores.
What was the total profit of the two companies together in 1996 ?
(e) The expenditure of company X in the year 1998 was ₹ 200 crores and the income of company X in 1998 was the same as its expenditure in 2001.
Find the income of company X in 2001.
3. Answer the following questions based on the information given below : The first table gives the percentage of students in MBA class who sought employment in the areas of finance, marketing and software. The second table shows the average starting salaries of the students per month (in ₹) in these areas. The third table gives the number of students who passed out in each year.
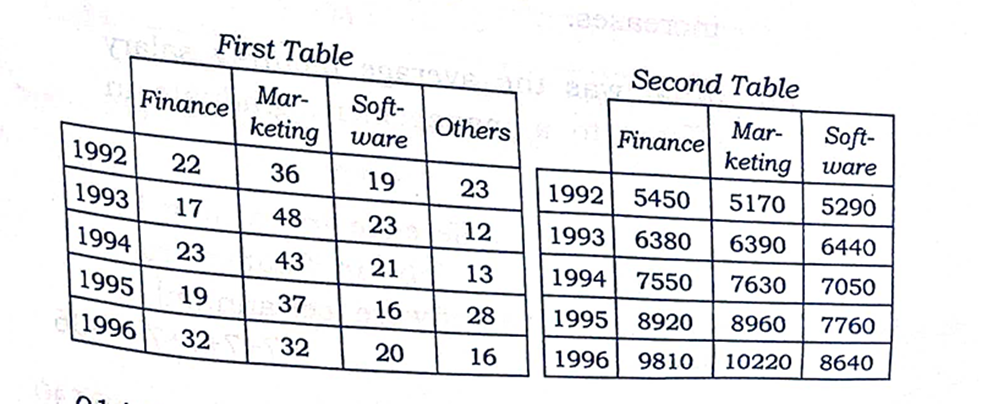
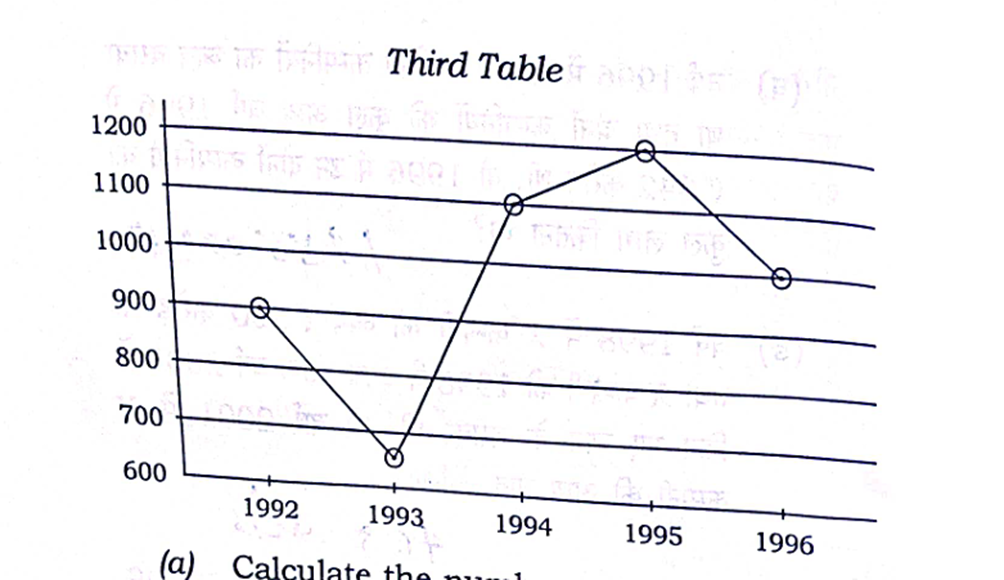
(a) Calculate the numbers of students who get jobs in finance less than students getting marketing jobs in five years.
(b) What was the percentage increase in the average salary of finance from 1992 to 1996 ?
(c) Find the average annual rate at which the initial salary offered in software increases.
(d) What was the average monthly salary offered to a management graduate in 1993 ?
(e) Calculate the difference in earnings by those opting for jobs in finance from students seeking jobs in software (per annum) in 1994.
4. A soft-drink company prepares drinks of three different flavours—X, Y and Z. The production of the three flavours over a period of six years has been expressed in a bar graph provided below. Study the graph and answer the questions based on it :
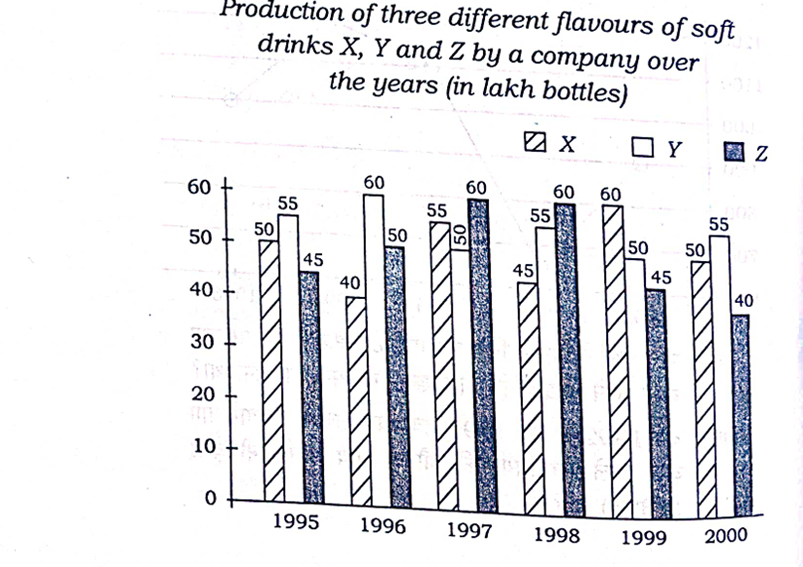
(a) For which year, the percentage of rise/fall in production from the previous year is the maximum for the flavour Y ?
(b) For which flavour the average annual production is maximum in the given period ?
(c) The total production of flavour Z in 1997 and 1998 is what percentage of the total production of flavour X in 1995 and 1996 ?
(d) What is the difference between the average production of flavour X in 1995, 1996 and 1997 and the average production of flavour Y in 1998, 1999 and 2000 ?
(e) What was the percentage decline in the production of flavour Z in 2000 as compared to the production in 1998 ?
8. BPSC Statistics Questions (67th BPSC)
The 67th BPSC Mains examination also included questions from the statistics section of GS Paper-I that tested candidates’ ability to interpret numerical data. These BPSC Statistics Questions were mainly based on charts, tables, and graphical representations that required careful analysis.
When aspirants practise bpsc mains statistics pyq from the 67th BPSC examination, they can observe that most questions involve calculations such as percentages, ratios, averages, and comparisons between different data sets. These questions require both numerical accuracy and clear understanding of the dataset provided.
Another key feature of these bpsc statistics pyq is that each dataset usually contains multiple sub-questions, which test different aspects of data interpretation. Candidates must read the information carefully before attempting calculations.
Studying these statistics pyq for bpsc mains helps aspirants improve their ability to interpret graphs and tables quickly, which is an important skill for solving statistics questions in the mains examination.
67th BPSC Statistics Questions
1. Study the following table carefully and answer the questions given below :
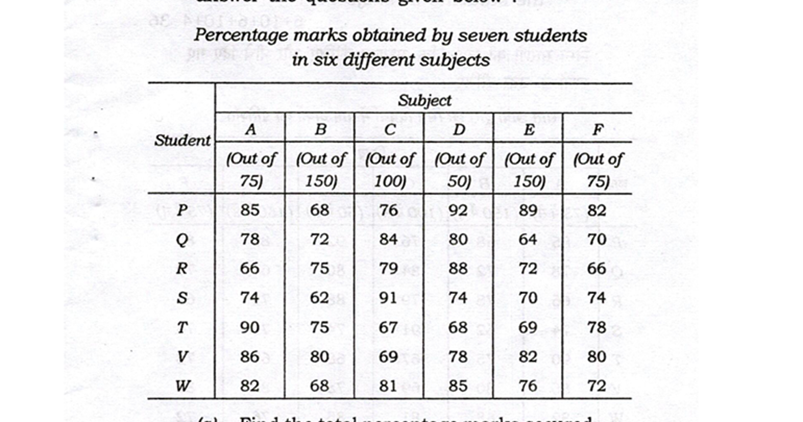
(a) Find the total percentage marks secured by R in all the six subjects together.
(b) Find the difference between the marks obtained by P in the subjects B, D and E together and marks obtained by T in the same subjects.
(c) Find the average marks obtained by all the students in the subject B.
(d) Find the average percent of marks obtained by all the students in the subject D.
(e) What is the total marks obtained by all the students in the subject F ?
2. Study the following pie-charts carefully and answer the questions given below :
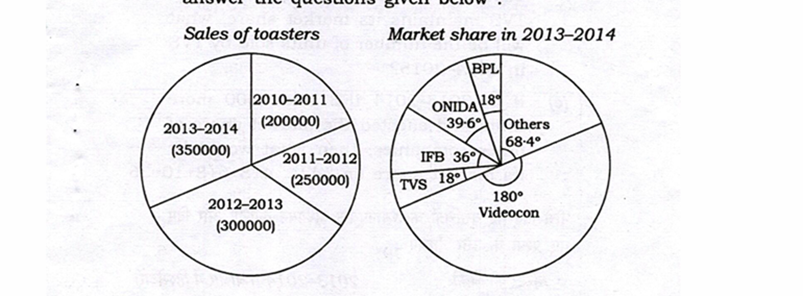
(a) Assuming that Videocon has maintained its market share at the same level from 2010–2011, what is the total number of toasters sold by Videocon in the four years ?
(b) If in 2012–2013, the market share of BPL was 7%, then what is the change in the market share of BPL from 2012–2013 to 2013–2014 ?
(c) If Maharaja is one of the companies included in ‘others’ and its sales constitutes 40% of ‘others’, then how many toasters of Maharaja were sold in 2013–2014 ?
(d) Assuming that the number of toasters sold increases at the same rate in 2014–2015 as it did from 2012–2013 to 2013–2014, and assuming further that TVS maintains its market share, what will be the number of units sold by TVS in 2014–2015 ?
(e) If in 2013–2014 IFB sold 7000 more units and affected the market share of other companies, then what would be its market share (in%)?
3. Study the following graph carefully and answer the questions given below :
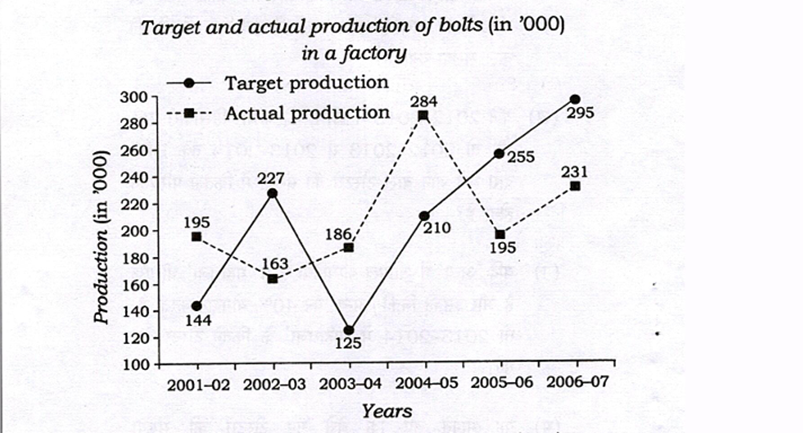
(a) What was the percentage change in the targeted production from 2004–2005 to 2005–2006 ?
(b) In which period was the percentage of actual production with respect to target production the highest ?
(c) What is the ratio of the number of years in which the actual production was above the average actual production to the number of years in which the actual production was below the average actual production ?
(d) Find the ratio of the sum of targeted production for the years 2002–2003, 2005–2006 and 2006–2007 to the sum of the actual production for these years.
(e) Find the difference between targeted production and actual production for the years 2002–2003 and 2004–2005 taken together.
4. The following bar graphs show the Per Capita Income and National Income of a country for the given years. Refer to the two bar graphs to answer the questions that follow :
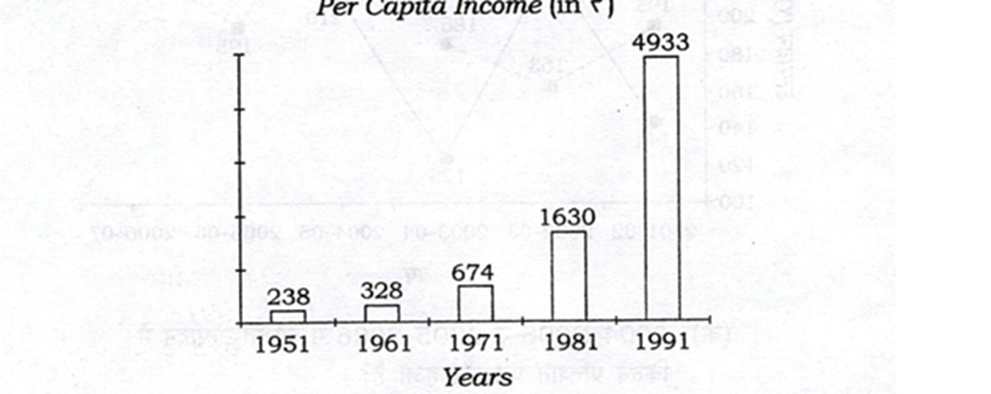
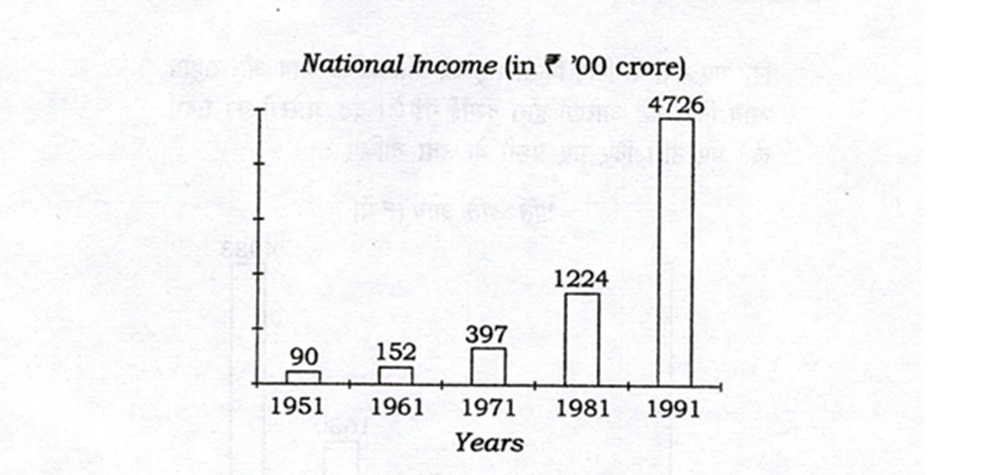
(a) What is the growth percentage in Per Capita Income from 1951 to 1991 ?
(b) What is the annual growth rate of Per Capita Income from 1961 to 1971 assuming that the growth was uniform throughout ?
(c) Find the country’s population during 1981.
(d) What was the growth rate in population during the decade 1981–1991 ?
(e) By how much percent the ‘National Income’ grew from 1951 to 1991 ?
9. BPSC Statistics Questions (68th BPSC)
The 68th BPSC Mains examination continued the trend of including data interpretation problems in the statistics section of GS Paper-I. These BPSC Statistics Questions required candidates to analyse information presented in tables and charts and perform numerical calculations based on the data.
When solving bpsc mains statistics pyq from the 68th BPSC examination, aspirants can see that many questions focus on percentage changes, ratios, averages, and comparison of numerical values. Such questions require careful reading of the dataset to avoid calculation errors.
Another noticeable feature of these bpsc statistics pyq is the emphasis on logical interpretation of trends and patterns in the data. Candidates must understand how different values are related before performing calculations.
Practising these statistics pyq for bpsc mains helps aspirants improve their problem-solving approach and develop confidence in handling numerical questions in the examination.
68th BPSC Statistics Questions
1. Study the following table carefully and answer the questions given below this table :
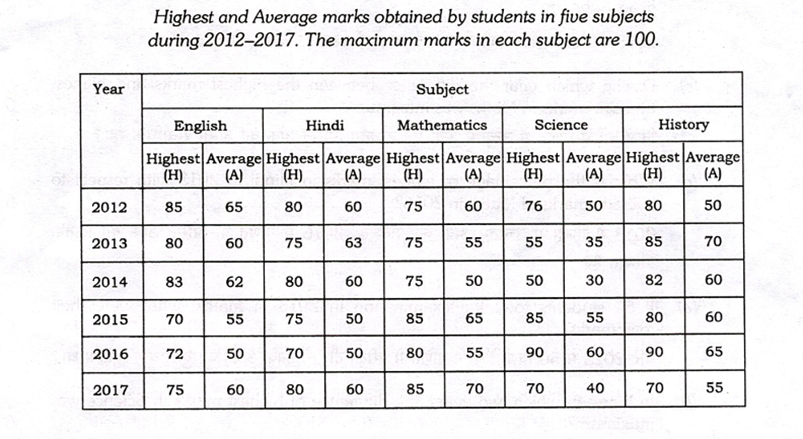
(a) What is the combined average marks of all the five subjects in 2015?
(b) What is the percentage increase in average marks of English from 2015 to 2017?
(c) During which year the difference between the highest marks and highest average marks in Maths was maximum?
(d) What is the percentage of highest marks in Hindi in 2013 with respect to average marks of Maths in 2016?
(e) If 50 students took the examination in 2013 in Maths, what were their total marks?
(f) In between which two years, the difference of highest marks in Science was maximum?
2. Study the following graph carefully and answer the questions given below :
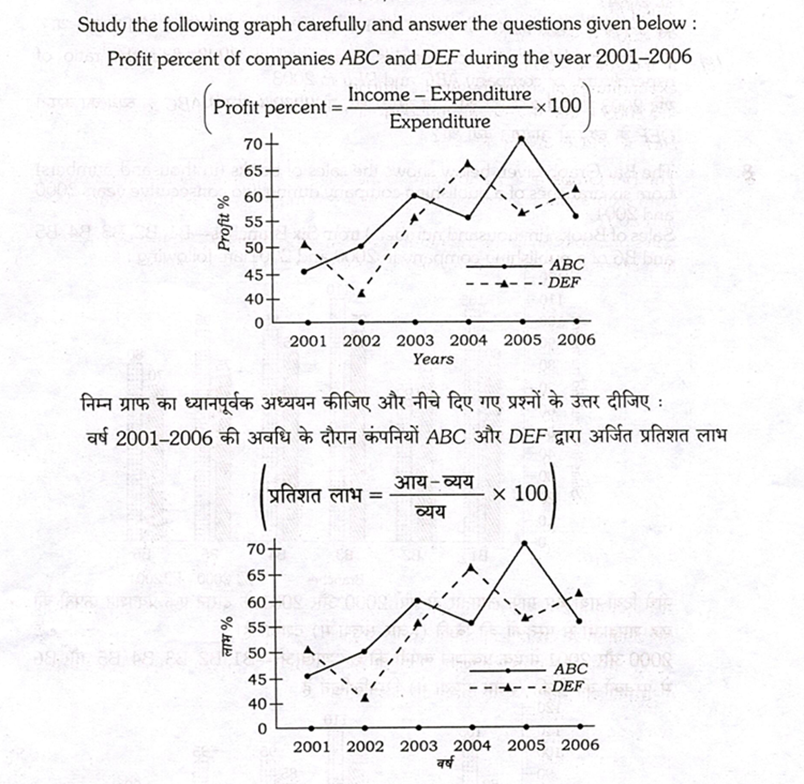
(a) Let the income in 2005 of companies ABC and DEF was in the ratio 3 : 4. What was the ratio of expenditures of companies ABC and DEF in 2005?
(b) If expenditure of company DEF in 2002 was ₹ 190 cr., what was its income in the year 2002?
(c) If expenditures of company ABC and DEF were equal in 2001 and total income of both the companies in 2001 was ₹ 825 cr., then what was the total profit of both the companies in 2001?
(d) Income of company ABC in 2004 was ₹ 750 cr. What was the expenditure in 2004?
(e) If income of both the companies was equal in 2003, find the ratio of expenditures of company ABC and DEF in 2003.
3. The Bar Graph given below shows the sales of books (in thousand numbers) from six branches of a publishing company during two consecutive years 2000 and 2001.
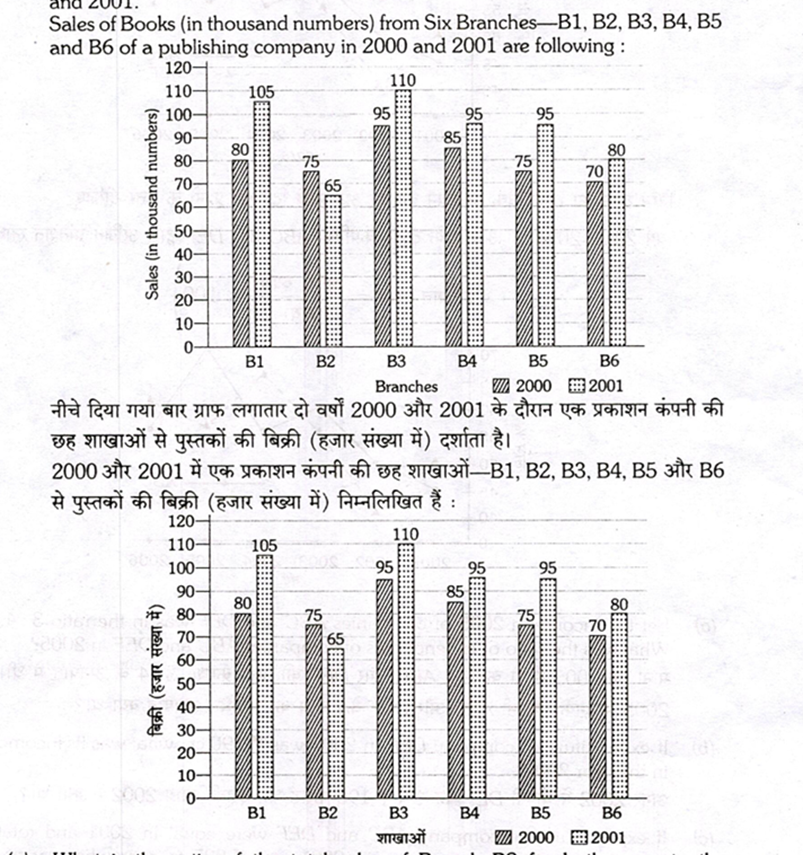
(a) What is the ratio of the total sales of Branch B2 for both years to the total sales of Branch B4 for both years?
(b) Total sales of Branch B6 for both the years are what percent of the total sales of Branch B3 for both the years?
(c) What percent of the average sales of branches B1, B2 and B3 in 2001 is the average sales of branches B1, B3 and B6 in 2000?
(d) What are the average sales of all the branches (in thousand numbers) for the year 2000?
(e) A total sale of branches B1, B3 and B5 together for both the years (in thousand numbers) is what?
4. The following pie-chart shows the percentage distribution of the total expenditure incurred by a company in different expense sections during 2015. Study the pie-chart and answer the questions given below :
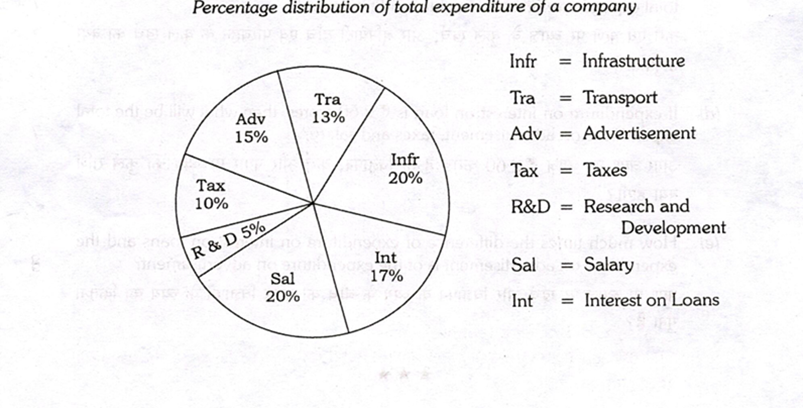
(a) How much times the total expenditure of the company is of expenditure of research and development?
(b) If expenditure on transport is ₹ 2 crores, then what will be the difference between the expenditures on salary and advertisement?
(c) What is the ratio of the total expenditure of taxes and interest on loans and total expenditure on infrastructure and transport?
(d) If expenditure on interest on loan is ₹ 2·60 crores, then what will be the total expenditure on advertisement, taxes and salary?
(e) How much times the difference of expenditure on interest on loans and the expenditure on advertisement is of the expenditure on advertisement?
10. BPSC Statistics Questions (69th BPSC)
The 69th BPSC Mains examination also included important questions from the statistics section of GS Paper-I. These BPSC Statistics Questions were based on interpreting numerical data provided through tables and graphical representations.
When aspirants analyse bpsc mains statistics pyq from the 69th BPSC examination, they can observe that most questions require calculations related to percentages, ratios, averages, and comparison of values between different categories. Accuracy in interpreting the data is crucial for solving these questions correctly.
Another important aspect of these bpsc statistics pyq is the presence of multiple sub-parts, where each part tests a different calculation or interpretation based on the same dataset.
Practising these statistics pyq for bpsc mains helps aspirants become familiar with the structure of statistics questions and improves their ability to perform calculations quickly during the examination.
69th BPSC Statistics Questions
1. Study the following table carefully and answer the questions given below this table : There are three companies X, Y and Z making identical soaps in the form of bars.
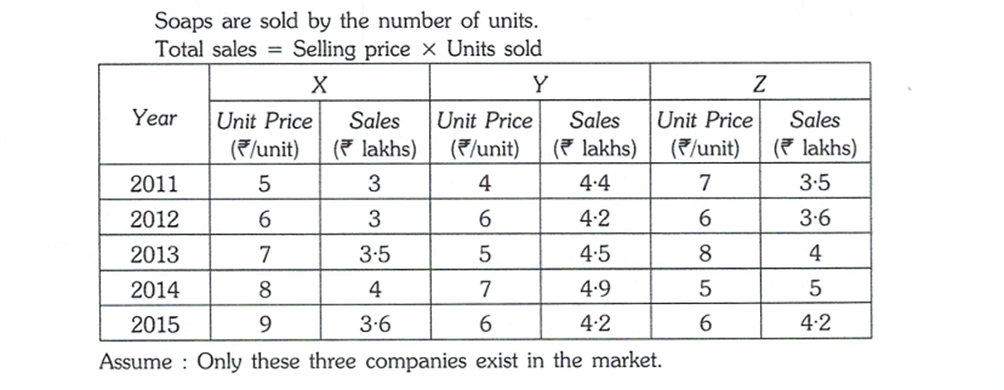
(a) What was the average price of soap in the year 2013 (₹/unit)?
(b) What was the percentage decrease in units sold for X in 2012 over 2011?
(c) What was the percentage share of Z in the total units sold in 2013?
(d) In which year Y sold the maximum number of units?
(e) The maximum price per unit given in the table exceeds the minimum price per unit by what percentage?
2. The following pie-chart shows the expenditure incurred on the manufacturing of a calculator under various heads. Study the pie-chart carefully and answer the questions given below :
Expenditure on Manufacturing of a Calculator
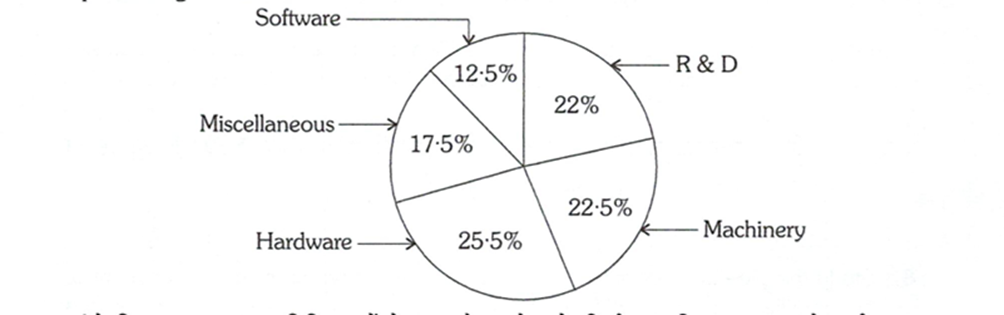
(a) What is the central angle of the sector showing the expenditure incurred on paying for the software?
(b) What is the cost price of the calculator on which the cost of R & D and machinery charges amount to ₹ 127·50?
(c) The marked price of a calculator is 24% more than its cost price.
If the marked price of a calculator be ₹ 186, then what is the cost price of R & D used in a single unit of calculator?
(d) If the machinery charges of a single unit be ₹ 58·50 and the marked price is 30% more than its cost price, then what is the marked price of the calculator?
(e) If the profit of the manufacturer is 20% and the marked price of a calculator be ₹ 192, then how much money has been spent on it as miscellaneous charges?
3. Study the pie diagrams given below carefully which represent the expenditure of two families I and II on different items in percentages and answer the questions asked below. The annual income of families I and II are ₹ 4 lakhs and ₹ 5 lakhs respectively :
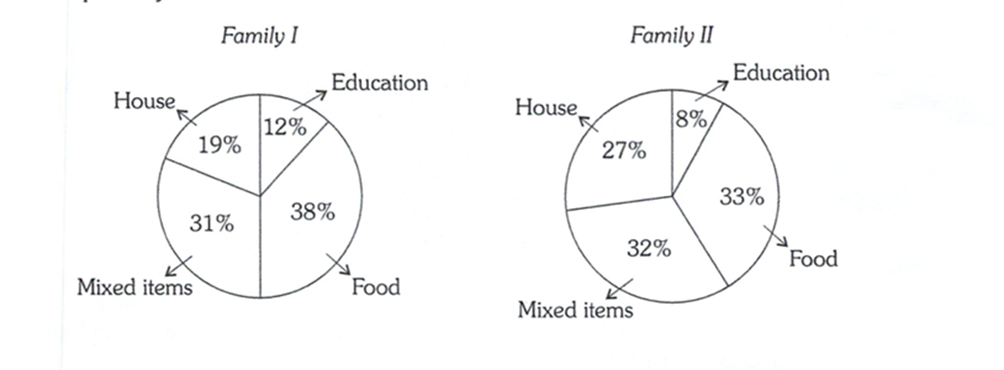
(a) How much less or more amount of money is spent on education by family II as compared to family I?
(b) Which one of the two families I and II spends more amount of money on food and how much?
(c) What is the proportion of money spent by families I and II on education?
(d) What would be the angle at the centre of pie diagram of money spent on housing by family I?
(e) How much money has been spent by families I and II together on mixed items?
4. The bar graph given below represents the additional tax collected by a State in different years. Study it carefully and answer the questions given below related to it :
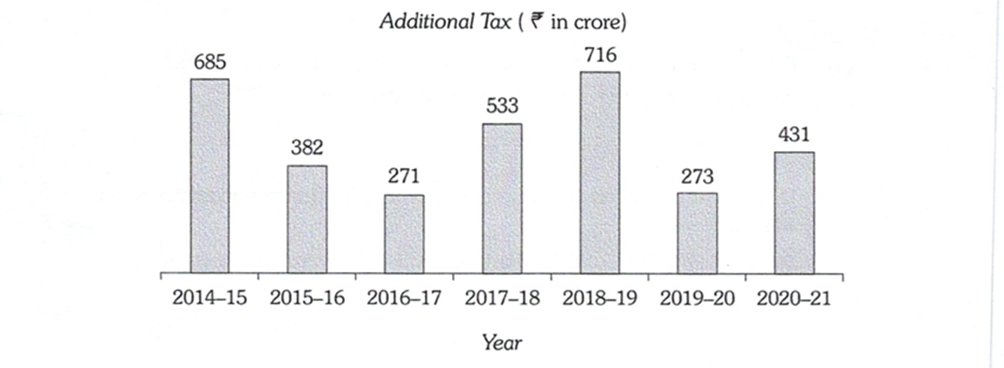
(a) How much percentage decrease in additional tax was registered in 2020–21 as compared to 2018–19?
(b) How much percentage increase in additional tax was registered in 2017–18 as compared to 2016–17?
(c) During which year the maximum percentage increase in additional tax was registered as compared to its preceding year?
(d) From 2014–15 to 2020–21, what is the average of additional tax?
(e) During which two consecutive years percentage of decrease in additional tax was minimum?
11. BPSC Statistics Questions (70th BPSC)
The 70th BPSC Mains examination also included questions from the statistics section of GS Paper-I that tested candidates’ ability to analyse numerical data. These BPSC Statistics Questions were based on charts, tables, and graphical datasets that required careful interpretation.
When practising bpsc mains statistics pyq from the 70th BPSC examination, aspirants can observe that the questions often involve percentage calculations, ratio analysis, averages, and comparison of values across different data points. These questions require both accuracy and speed in calculations.
Another key feature of these bpsc statistics pyq is the requirement to interpret the entire dataset before solving the individual sub-questions. Candidates must clearly understand the data relationships to answer correctly.
Studying these statistics pyq for bpsc mains helps aspirants understand the latest pattern of statistics questions and improve their performance in the mains examination.
70th BPSC Statistics Questions
1. The following table demonstrates the number of candidates appeared, qualified and selected in a competitive examination from five States Delhi, Himachal Pradesh (H.P.), Uttar Pradesh (U.P.), Punjab and Haryana over the years 1994 to 2000. Study the table carefully and answer the questions given below it :
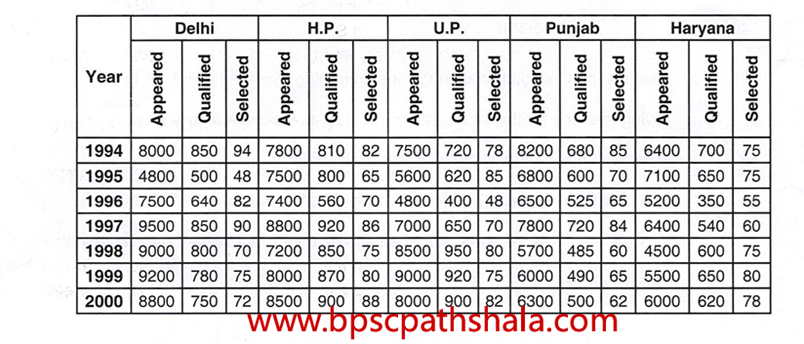
(a) For which State the average number of candidates selected over the years is maximum ?
(b) For which year the percentage of candidates qualified from Haryana over the candidates appeared from Haryana is highest ?
(c) In the year 1999, which State had the lowest percentage of candidates selected over the candidates appeared from that State ?
(d) For which State the ratio of candidates selected and the candidates qualified is highest for the year 1997 ?
(e) Which State has the highest percentage of total candidates selected over the total candidates appeared from that State during the years under consideration ?
(f) Find the ratio of the total candidates selected, qualified and appeared from U.P. during the year 1994 to 2000.
2. The bar diagram given below shows the production (in tons) of three crops – paddy, wheat and maize during the years 2002 to 2005 in a country. Study the diagram carefully and answer the questions given below it :
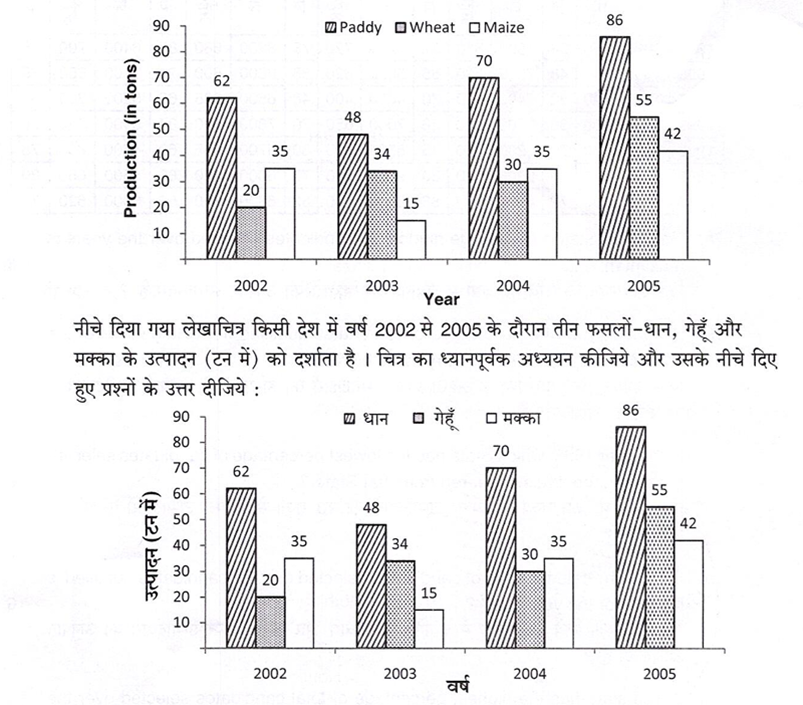
(a) What is the ratio of total production of paddy, wheat and maize in the country during the year 2002 to 2005 ?
(b) The total production of maize is what percentage of the total production of the three crops during the years under consideration ?
(c) The average production of wheat is what percentage of the average production of paddy during the years under consideration ?
(d) What percentage of the production of maize should be increased or decreased, so that the total production of maize is exactly half of the total production of paddy in the country during 2002–2005 ?
(e) If in the year 2004, the production of wheat is increased by 50% and the production of paddy is decreased by 40%, then what percentage of the production of wheat will be the production of paddy ?
3. The following pie-charts represent the expenditure (in rupees) of two families A and B. Study the charts carefully and answer the questions given below them :
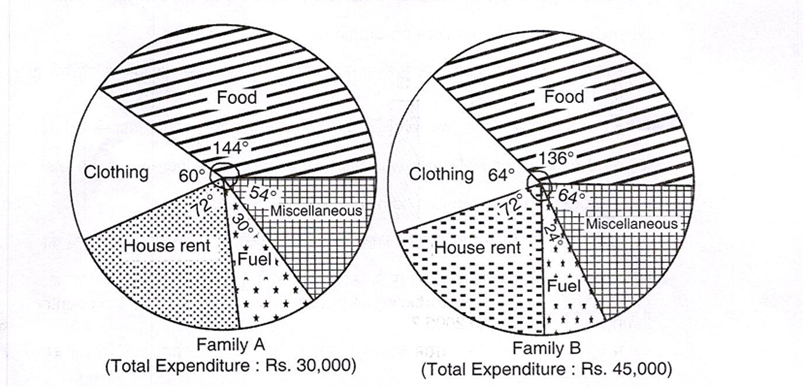
(a) What is the total expenditure of the two families (in rupees) on food ?
(b) The total expenditure of the two families on fuel is what percent of the total expenditure of the two families on clothing ?
(c) If the expenditure of the two families on food and house rent is increased by 20% and 30% respectively, then what will be the percentage increase in the total expenditure of the two families combined ?
(d) The expenditure on clothing for the two families is increased by 15%.
What percentage of expenditure on miscellaneous should be decreased by the two families separately, so that their total expenditure remains the same ?
(e) If the expenditure of the two families on food, clothing and house rent is increased by 10%, 20% and 30% respectively, then find the ratio of their total expenditures ?
4. The graph given below shows the exports from three companies X, Y and Z (in Rs. crores) during the years 1993 to 1999. Study the graph carefully and answer the questions given below it :
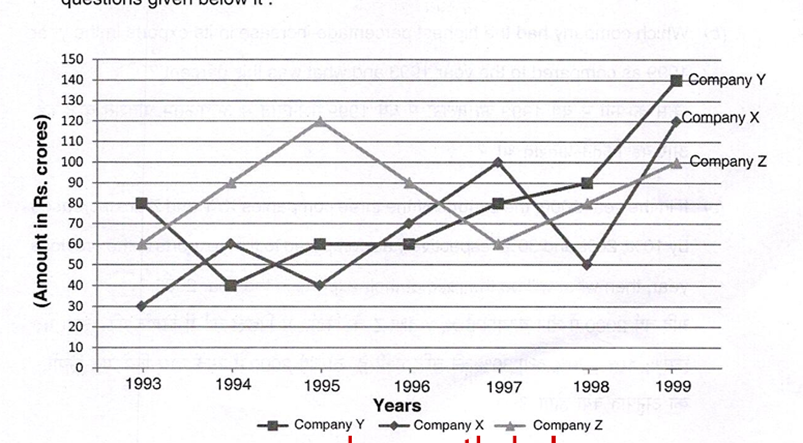
(a) Which company had the steepest rise in its exports compared to the previous year and in which year ?
(b) Which company had the highest percentage increase in its exports in the year 1999 as compared to the year 1993 and what was this percent ?
(c) If in the year 2000, the exports of the three companies X, Y and Z are increased by 10%, 20% and 30% respectively as compared to their exports in the previous year, then what will be the ratio of their exports in the year 2000 ?
(d) What percentage of export should be increased by the companies X and Y in the year 1996, so that their export becomes double of the export done by company Z in the year 1996 ?
(e) If in 1992, the export by the company Z was 30% less than that in 1993 and the export by the company X was 30% more than that in 1993, then what was the difference (in Rs. crores) between the exports by the companies Z and X in the year 1992 ?
12. Trend Analysis of BPSC Statistics PYQ in Mains
A careful study of BPSC Statistics Questions from previous years shows that the commission follows a fairly consistent pattern in Section-III of GS Paper-I. Most questions are based on data interpretation through tables, pie charts, bar diagrams, and line graphs.
When aspirants analyse bpsc statistics pyq, they can observe that the questions generally require basic arithmetic calculations rather than advanced mathematics. Candidates are expected to calculate percentages, ratios, averages, and comparisons between different data sets.
Another important trend in bpsc mains statistics pyq is that questions often contain multiple parts, where each sub-question tests a different aspect of data interpretation. This structure requires candidates to carefully analyse the given data before attempting calculations.
Understanding the trend of statistics pyq for bpsc mains helps aspirants prepare strategically and develop the ability to solve data-based questions accurately in the examination.
13. Types of Statistics Questions Asked in BPSC Mains
In the BPSC mains examination, BPSC Statistics Questions generally focus on data interpretation and numerical reasoning. These questions are designed to test a candidate’s ability to analyse information presented in different graphical or tabular formats.
Common types of questions seen in bpsc statistics pyq include pie charts, bar graphs, line graphs, tables, and comparative data sets. Candidates may be asked to calculate percentages, ratios, averages, growth rates, or differences between different data values.
Another important feature of bpsc mains statistics pyq is that questions often require logical interpretation of data trends rather than simple numerical calculations. Candidates must carefully read the data and understand relationships between different variables.
By practising statistics pyq for bpsc mains, aspirants become comfortable with these question formats and learn how to approach data-based problems efficiently in the examination.
14. Important Concepts Identified from Statistics PYQ for BPSC Mains
A careful study of BPSC Statistics Questions from the 60th to the 70th BPSC examinations shows that certain numerical concepts appear repeatedly in the statistics section of GS Paper-I. Understanding these concepts helps aspirants prepare more effectively and solve questions with greater confidence.
When aspirants analyse bpsc mains statistics pyq, they can observe that most questions require calculations based on percentages, ratios, averages, and comparisons between different numerical values. These basic arithmetic concepts form the foundation of many statistics questions asked in the examination.
Another common feature seen in bpsc statistics pyq is the interpretation of tables, pie charts, bar graphs, and line graphs. Candidates must carefully study the dataset before performing calculations in order to avoid errors.
By practising these statistics pyq for bpsc mains, aspirants can identify important patterns and improve their ability to interpret data quickly. A strong understanding of these concepts helps candidates solve statistics questions accurately and score well in the mains examination.
15. How to Solve BPSC Statistics Questions in Mains
Solving BPSC Statistics Questions in the mains examination requires both careful observation and accurate calculations. Since most questions are based on data interpretation, candidates must first read the given chart, table, or graph carefully before attempting the calculations.
While practising bpsc mains statistics pyq, aspirants should focus on identifying the important numerical values and relationships within the dataset. This helps in understanding the problem clearly and selecting the correct calculation method.
Another useful strategy when solving bpsc statistics pyq is to perform calculations step by step. Writing intermediate steps helps avoid mistakes and makes it easier to check the final answer.
Regular practice of statistics pyq for bpsc mains improves both speed and accuracy. With consistent practice, aspirants can quickly interpret numerical data and solve statistics questions confidently during the examination.
16. BPSC Statistics PYQ PDF for Quick Revision
Many aspirants prefer revising previous year questions in a compiled PDF format during the final stage of preparation. A well-organised collection of BPSC Statistics Questions helps candidates quickly review important datasets and question patterns before the mains examination.
This page functions like a structured bpsc statistics pyq pdf resource, where aspirants can access exam-wise statistics questions from the 60th to the 70th BPSC mains examinations. Instead of searching multiple sources, candidates can revise all important statistics questions in one place.
Using a bpsc statistics pyq pdf approach is helpful for quick revision because it allows aspirants to review important graphs, tables, and calculation-based questions efficiently.
Regular revision of statistics pyq for bpsc mains strengthens numerical understanding and helps aspirants become more comfortable with data interpretation questions in the mains examination.
17. Conclusion
Preparing for the statistics section requires a clear understanding of the pattern of BPSC Statistics Questions asked in previous examinations. Analysing questions from the 60th to the 70th BPSC mains helps aspirants identify the most important numerical concepts and data interpretation techniques.
Practising bpsc mains statistics pyq allows candidates to become familiar with different types of graphs, charts, and tables used in the examination. Regular practice also improves calculation accuracy and time management during the mains exam.
Another important benefit of solving bpsc statistics pyq is that it helps aspirants understand how multiple sub-questions are framed from a single dataset. This improves the ability to interpret data logically and perform correct calculations.
Therefore, consistent practice of statistics pyq for bpsc mains is essential for mastering this scoring section and performing well in the BPSC mains examination.
BPSC Statistics Questions FAQs
Q1. In which paper are BPSC Statistics Questions asked in BPSC Mains?
In the BPSC Mains examination, BPSC Statistics Questions are asked in GS Paper-I under Section-III. This section specifically focuses on data interpretation and numerical analysis based on charts, tables, graphs, and datasets. Candidates are required to carefully analyse the given information and perform calculations such as percentages, ratios, averages, and comparisons. Since BPSC Statistics Questions are part of GS Paper-I, aspirants must prepare this section along with other GS topics to ensure balanced performance in the mains examination.
Q2. Is the BPSC Statistics Questions section compulsory in BPSC Mains?
Yes, the section containing BPSC Statistics Questions is compulsory in the BPSC Mains examination. Section-III of GS Paper-I generally includes statistics or data interpretation problems that every candidate must attempt. Since BPSC Statistics Questions carry fixed marks and require objective calculations, they provide a good opportunity for aspirants to score well if they practise regularly and develop accuracy in numerical interpretation.
Q3. What level of mathematics is required for BPSC Statistics Questions?
The level of mathematics required for BPSC Statistics Questions is quite basic. Candidates mainly need to understand fundamental arithmetic concepts such as percentages, ratios, averages, and simple numerical comparisons. Advanced mathematics or complex formulas are usually not required. Most BPSC Statistics Questions are based on interpreting data presented in graphs or tables and performing straightforward calculations based on that information.
Q4. How many years of BPSC Statistics Questions should be practised?
For effective preparation, aspirants should practise at least 10 to 12 years of BPSC Statistics Questions from previous mains examinations. Solving past papers helps candidates understand the structure and difficulty level of BPSC Statistics Questions and become familiar with the types of graphs, tables, and numerical datasets commonly used in the examination.
Q5. How much time should be allotted to BPSC Statistics Questions in the exam?
During the BPSC Mains examination, candidates should ideally allocate around 30 to 40 minutes to solve BPSC Statistics Questions in Section-III of GS Paper-I. The exact time may vary depending on the complexity of calculations, but careful time management ensures that candidates can interpret the data properly and avoid mistakes while solving the questions.